
After completing or pausing the calculations, the CFD Display Options data panel is shown in the bottom left of the screen and the Select CFD slice tool becomes enabled (above). This is the main mechanism for displaying results. It allows you to select a slice along one of the main grid axes and perpendicular to it, within which any of the selected results can be displayed.
After selecting the Select CFD slice tool, the CFD results screen is displayed which includes the model view together with a slice selection frame, perpendicular to the currently selected axis. You can select a slice along the current axis by moving the mouse cursor across the model in the direction of the axis. To change the axis, click on the required axis on the axis selector tool, which is located at the top right of the screen:
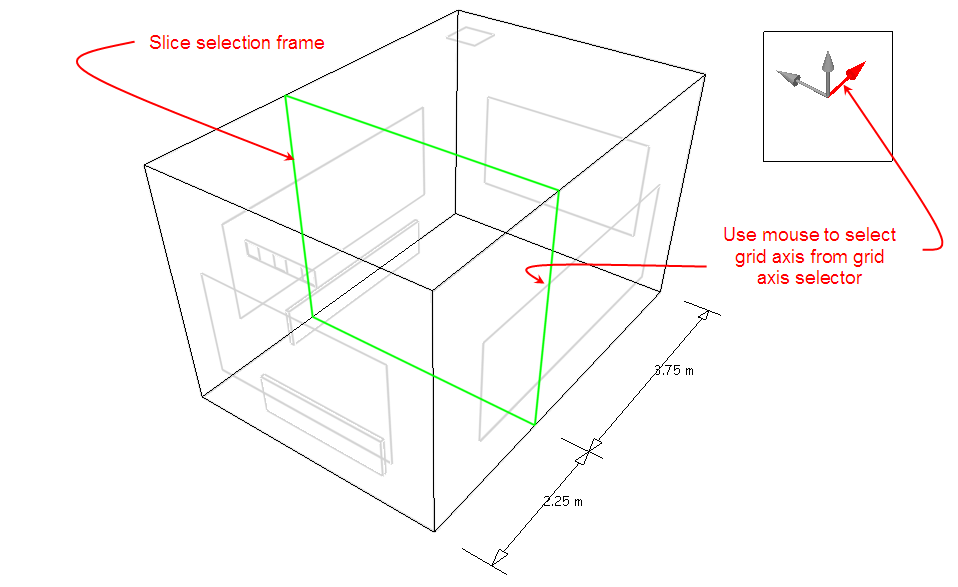
After selecting the required axis and moving the slice selector frame to the required position along the axis, click the mouse button to add the slice to the display. Notice that as you move the slice selection frame to a slice that was previously added to the display, the frame colour changes from green to red and if you click the mouse button, the slice is removed from the display:

Slice variable plots are selected under the ‘Slice Settings’ header on the Display Options data panel and controlled under the ‘Variable Settings’ header:
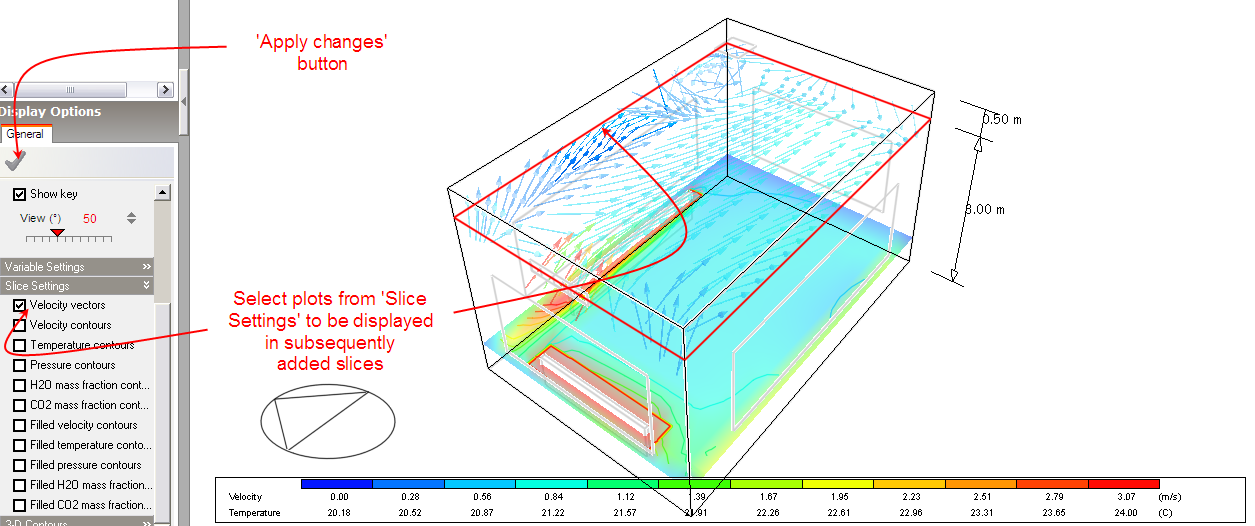
Note that any modifications made to items on the Display Options data panel will only come into effect after clicking on the ‘Apply changes’ button.
The ‘Variable Settings’ group contains groups of variable banding data for velocity, temperature and pressure variables. Also, under the variable settings ‘Velocity’ header, there are two velocity vector settings, ‘Maximum vector length’ and ‘Velocity scale factor’. Velocity vectors are displayed as arrows, the length of which corresponds to the magnitude of the velocity and with the default vector scale factor of 1.0, a length of 1.0m corresponds to a magnitude of 1.0m/s. The maximum vector length is the maximum length of a vector that will be displayed to prevent the display from becoming cluttered with excessively large vectors. Any vector, which has a magnitude greater than this maximum, will be displayed translucently to distinguish it from vectors with lengths that do represent magnitude.
The variable banding data comprises the defined band range, followed by twelve contour band values within the defined range. The band range defines the minimum and maximum variable values between which data will be displayed and the band values are the actual values within that range that are displayed in the form of contours or in the case of velocity vectors, vector colours. The default minimum and maximum variable display values are extracted from the calculated values and this range is then divided into twelve equal increments in order to arrive at the dependent variable contour bands. Each contour band can be edited or switched off altogether. When the band range values are modified, the individual band values are automatically re-calculated.
The ‘Slice Settings’ group is used to select the plots required to be included in subsequently added slices.
The last item on the Display Options data panel is the 3-D contours group that allows you to select any of the available variables for which a 3-D contour plot is required:

Tip: You can export the calculated values for all displayed CFD slices to a csv file by clicking on the File > Export > Export CFD results slices item.